TAAT e-catalog
for
government
https://e-catalogs.taat-africa.org/gov/technologies/agrocares-scanner-soil-feed-and-leaves-nutrient-scanner
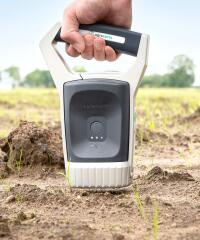
Scan Nutrients. Get Answers. Act Fast.
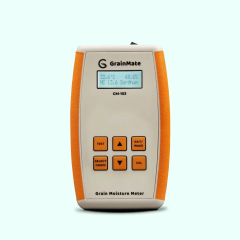
For national extension systems and public agriculture programs, the AgroCares Nutrient Scanner provides a fast and portable solution for testing soil, crop, and feed samples in the field. The device pairs with a smartphone via Bluetooth and operates through AgroCares’ suite of mobile apps. Using near-infrared (NIR) sensing, it reads the sample’s nutrient profile and sends the data to a global cloud database. In minutes, it returns a detailed report with nutrient values and actionable recommendations to guide fertilizer application, crop management, or livestock feeding. This tool helps government teams deliver timely, evidence-based advice at scale, even in areas without access to laboratory infrastructure.
This technology is pre-validated.
Adults 18 and over: Positive high
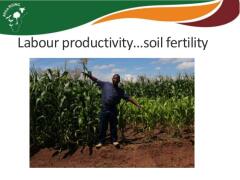
The scanner has direct benefits for adult farmers and communities. For smallholder farmers, on-site soil testing leads to better crop management, higher yields, and improved food security, creating a safer and more resilient livelihood. In remote areas with limited access to resources, this technology helps optimize fertilizer use and farming practices, leading to more stable harvests and income.
The poor: Positive high
Smallholder farmers with limited financial resources stand to gain significantly from this technology. Traditionally, soil and feed testing has been expensive or logistically unreachable for poor rural farmers – requiring paid lab analysis and travel to distant facilities. AgroCares addresses this by enabling in-situ testing at minimal cost per sample. Public or cooperative sector initiatives often purchase the device and then offer testing services to members at subsidized rates or for free.
Under 18: Positive low
No direct impact. Increased food productivity and therefore revenues in farming families allows parents to match their economic needs with less support from the young generations, which could allow the young them to spend more time in higher education.
Women: Positive medium
The scanning technology is gender-neutral in design – it can be utilized by both men and women farmers. While AgroCares did not originally set out with a specific gender focus, there is evidence that it can particularly empower women in agriculture. A market analysis by Mercy Corps Agrifin and Busara found that although young farmers were more likely to try soil testing, women were even more likely than men to follow through on the recommended actions after testing
Climate adaptability: Highly adaptable
The scanner device has been designed for use in diverse climates and field conditions worldwide. It is rugged, portable, and built to withstand harsh environments. According to its technical specifications, the unit is IP65 rated – meaning it is dust-tight and resistant to water jets – and it passes standard drop/shock tests.
Farmer climate change readiness: Significant improvement
By using the scanner’s insights, farmers can make their operations more resilient to climate extremes and variability. A key feature is the monitoring of soil organic matter and carbon content – crucial indicators of soil health. Healthier, carbon-rich soils have higher water holding capacity and better structure. In fact, soil organic matter can increase a soil’s water retention by roughly 25–35% in loamy soils.
Biodiversity: Positive impact on biodiversity
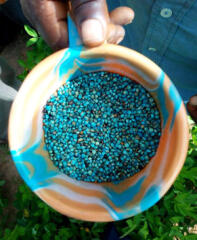
The AgroCares approach encourages balanced nutrient management and reduced chemical overuse, which benefits both soil biodiversity and the broader ecosystem. Regular soil analysis promotes nutrient balance – farmers correct deficiencies and avoid surplus fertilizer applications. This is important because heavy, imbalanced fertilizer use (especially of nitrogen and phosphorus) can degrade soil life and microbial diversity over time.
Carbon footprint: Much less carbon released
Compared to a traditional wetchem laboratory, Agrocares does not use any consumables, which reduces all the footprint caused by all these reagents. Secondly, sample movement from the farm to the laboratory is not required when using the sensor, which nullifies all the transporting and logistics related emissions.
Environmental health: Greatly improves environmental health
Inefficient environmental externalities (e.g. N leaching, P leaching, water pollution) caused by farming systems can be reduced with regular testing and by adopting the recommendation offered for soil management, leaf fertilization and feed formulation.
Soil quality: Improves soil health and fertility
The technology is specifically designed to have a drastic improvement on soil fertility, health and nutrient cycles.
Water use: Much less water used
If farmers follow the irrigations advice which can be formulated with a test from the Agrocares scanner (we produce reports on texture class and water related soil functions), less water can be used while maintaining productivity targets.
Governments can transform national extension and soil health programs by adopting portable soil diagnostic tools that offer rapid, localized results.
Integration Steps:
Procure & equip staff
Distribute scanners along with smartphones and valid app licenses to extension officers. Ensure compatibility with Android 6/iOS7+.
Deliver comprehensive training
Conduct hands-on workshops with demonstrations, printed guides, and regular refresher sessions—following successful models like those used in Bungoma County, Kenya.
Embed into field visits
Agents use the scanner during routine farm visits to test soil, leaf, or feed samples on-site. Results are shared instantly to support fertilizer or feeding decisions.
Centralize data collection
Sync scan data to a cloud database to generate nutrient maps, monitor soil fertility trends, and inform national fertilizer subsidy or land restoration policies.
Engage communities
Use local demos and farmer mobilization events to build trust, with support from local leaders and cooperatives to encourage widespread adoption.
Evaluate & iterate
Monitor usage (e.g. scans per agent), collect farmer feedback, and assess changes in input use or productivity to refine rollout strategy.
Every USD invested returns USD 0.81 net income.
Patent granted, Copyright, Trademark
Scaling Readiness describes how complete a technology\’s development is and its ability to be scaled. It produces a score that measures a technology\’s readiness along two axes: the level of maturity of the idea itself, and the level to which the technology has been used so far.
Each axis goes from 0 to 9 where 9 is the “ready-to-scale” status. For each technology profile in the e-catalogs we have documented the scaling readiness status from evidence given by the technology providers. The e-catalogs only showcase technologies for which the scaling readiness score is at least 8 for maturity of the idea and 7 for the level of use.
The graph below represents visually the scaling readiness status for this technology, you can see the label of each level by hovering your mouse cursor on the number.
Read more about scaling readiness ›
Uncontrolled environment: validated
Common use by intended users, in the real world
| Maturity of the idea | Level of use | |||||||||
| 9 | ||||||||||
| 8 | ||||||||||
| 7 | ||||||||||
| 6 | ||||||||||
| 5 | ||||||||||
| 4 | ||||||||||
| 3 | ||||||||||
| 2 | ||||||||||
| 1 | ||||||||||
| 1 | 2 | 3 | 4 | 5 | 6 | 7 | 8 | 9 | ||
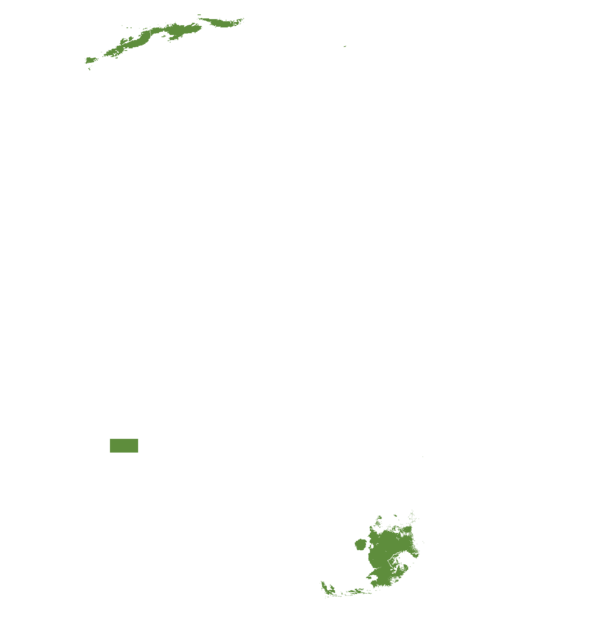
| Project | Countries | Beneficiaries | Budget (USD) & duration | Key figures |
|---|---|---|---|---|
|
AFMPFNSHoA Additional Financing to Multinational Programme for Food & Nutrition Security in the Horn of Africa |
|
|
5.4 million 2022–2026 |
|
|
Post-Cyclone Recovery Programme Post Cyclone IDAI and Kenneth Emergency Recovery and Resilience Programme |
|
|
58,24 million 2022–2026 |
|
|
PROCAVA Inclusive Agri-Food Value Chain Development Project |
|
|
105.45 million 2024–2028 |
|
Figures in italic are from project plans and may change during implementation.
|
Cost of the investment Sum of all fixed and operational expenses.. |
USD 11,068 per year |
|---|---|
|
Gross revenue Sum of all income before subtracting costs. |
USD 20,000 per year |
|
Net income Gross revenue minus total cost. |
USD 8,932 per year |
|
Return on investment Percentage of income earned for each dollar invested, calculated as: (income ÷ cost of investment) × 100 |
81 % per year |
| Country | Testing ongoing | Tested | Adopted |
|---|---|---|---|
| Angola | Testing ongoing | –Not tested | –Not adopted |
| Burundi | –No ongoing testing | Tested | Adopted |
| Cameroon | Testing ongoing | –Not tested | –Not adopted |
| Comoros | Testing ongoing | –Not tested | –Not adopted |
| Côte d’Ivoire | –No ongoing testing | Tested | Adopted |
| Democratic Republic of the Congo | Testing ongoing | –Not tested | –Not adopted |
| Egypt | Testing ongoing | –Not tested | –Not adopted |
| Eritrea | Testing ongoing | –Not tested | –Not adopted |
| Ethiopia | –No ongoing testing | Tested | –Not adopted |
| Ghana | –No ongoing testing | Tested | –Not adopted |
| Kenya | –No ongoing testing | Tested | Adopted |
| Malawi | –No ongoing testing | Tested | –Not adopted |
| Morocco | Testing ongoing | –Not tested | –Not adopted |
| Mozambique | Testing ongoing | –Not tested | –Not adopted |
| Namibia | –No ongoing testing | Tested | Adopted |
| Niger | Testing ongoing | –Not tested | –Not adopted |
| Nigeria | –No ongoing testing | Tested | Adopted |
| Republic of the Congo | Testing ongoing | –Not tested | –Not adopted |
| Rwanda | –No ongoing testing | Tested | Adopted |
| Somalia | Testing ongoing | –Not tested | –Not adopted |
| South Africa | –No ongoing testing | Tested | –Not adopted |
| South Sudan | Testing ongoing | –Not tested | –Not adopted |
| Sudan | Testing ongoing | –Not tested | –Not adopted |
| Tanzania | –No ongoing testing | Tested | Adopted |
| Uganda | –No ongoing testing | Tested | Adopted |
| Zambia | –No ongoing testing | Tested | Adopted |
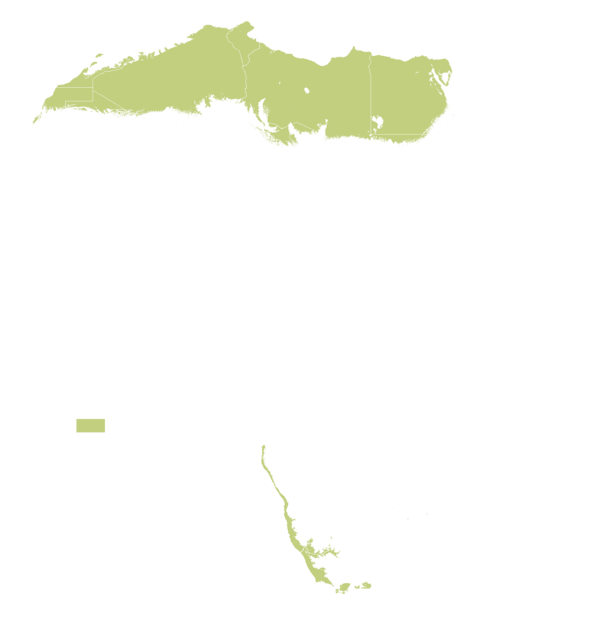
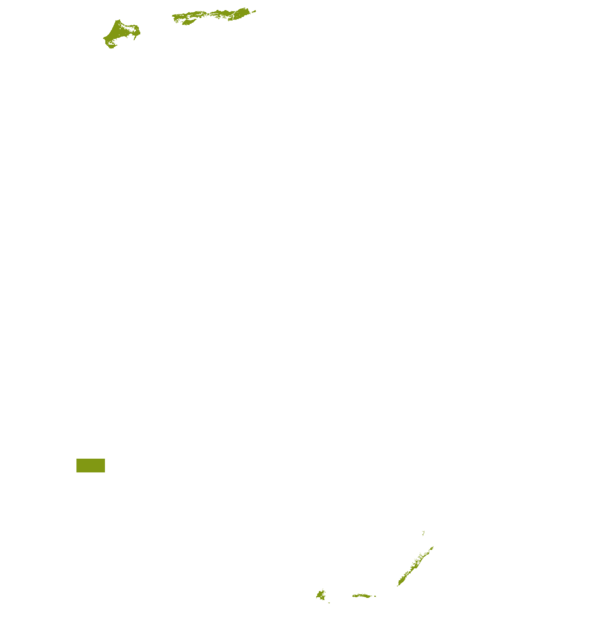
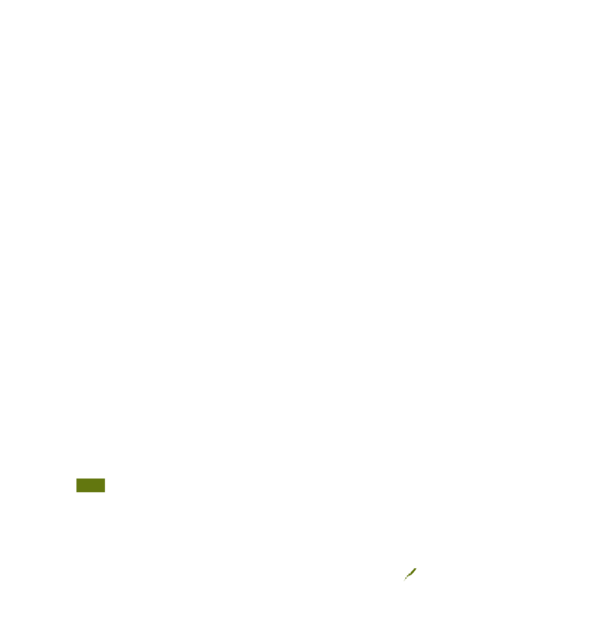
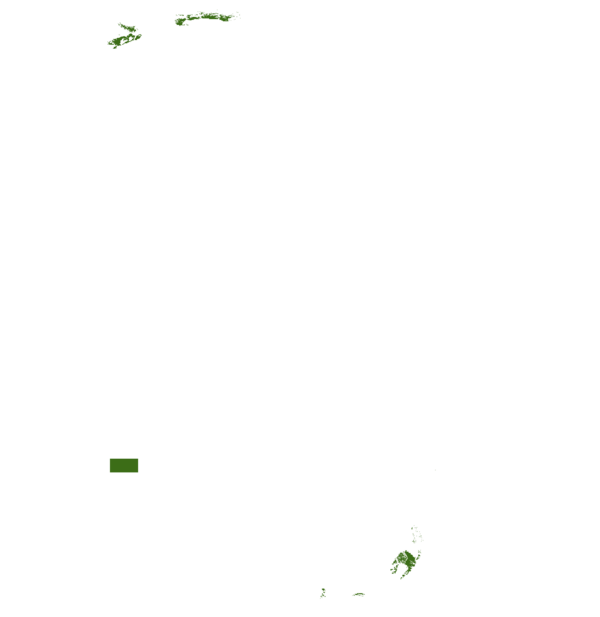
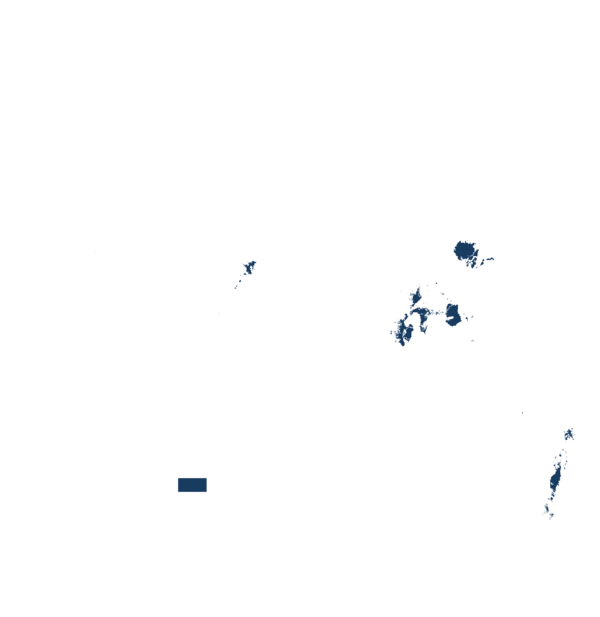
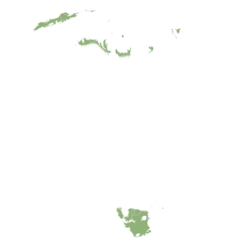
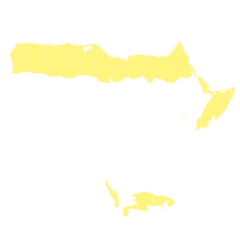
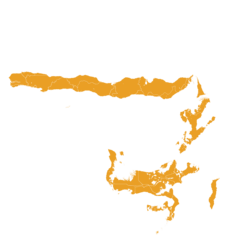
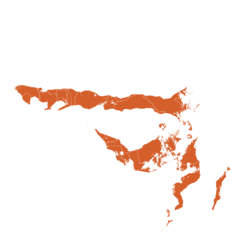
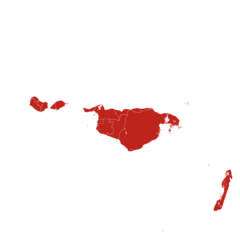
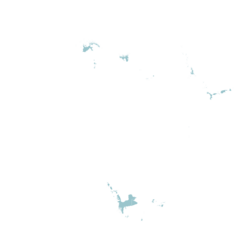
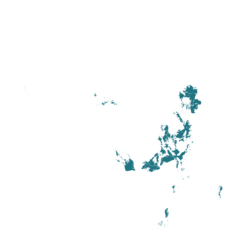
This technology can be used in the colored agro-ecological zones. Any zones shown in white are not suitable for this technology.
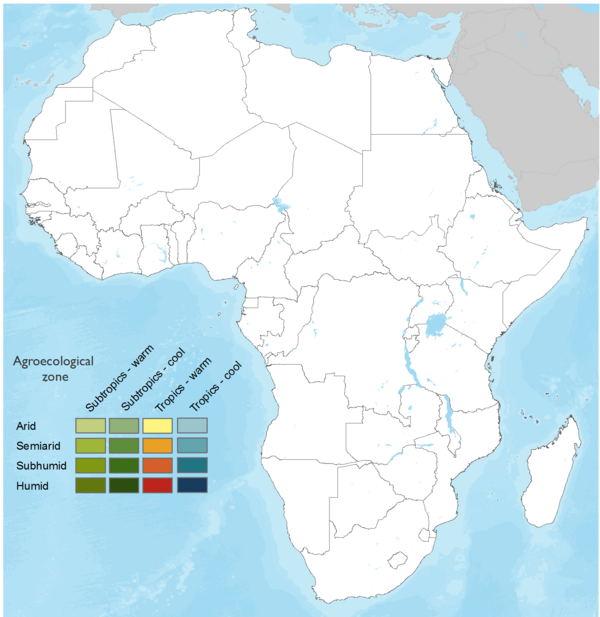


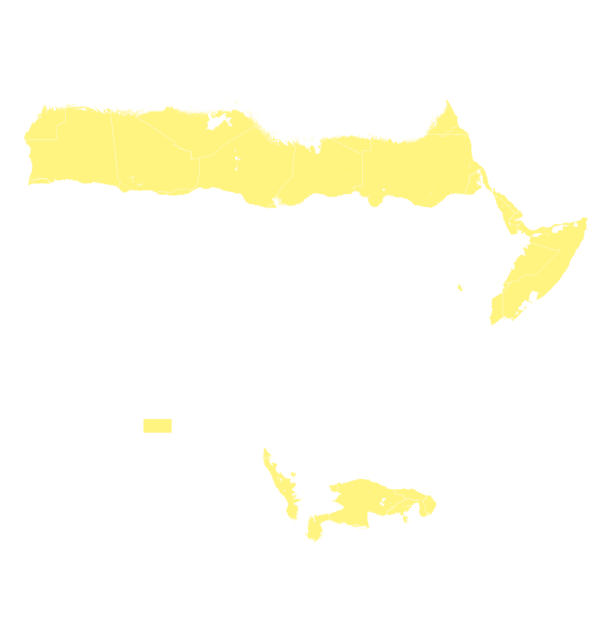
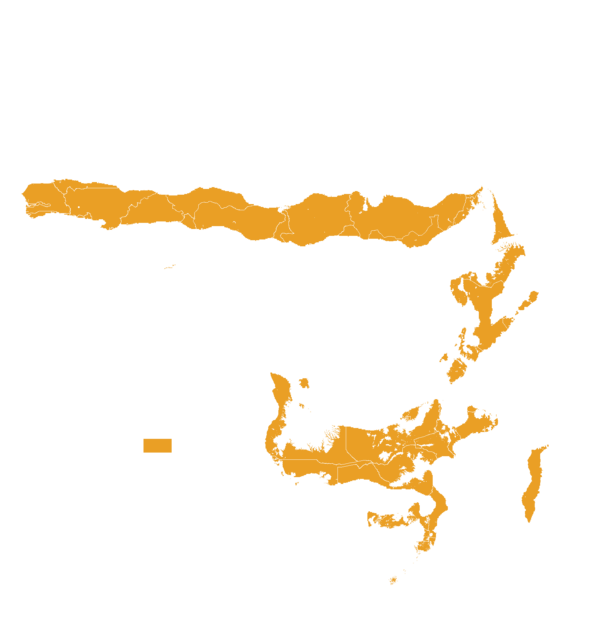
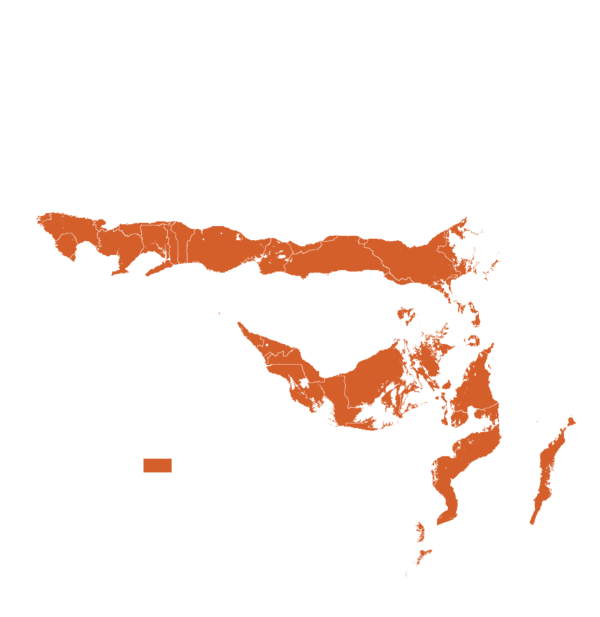

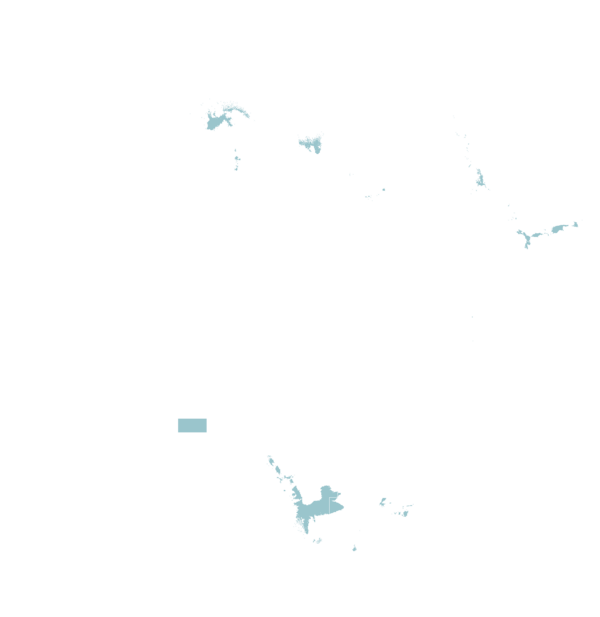

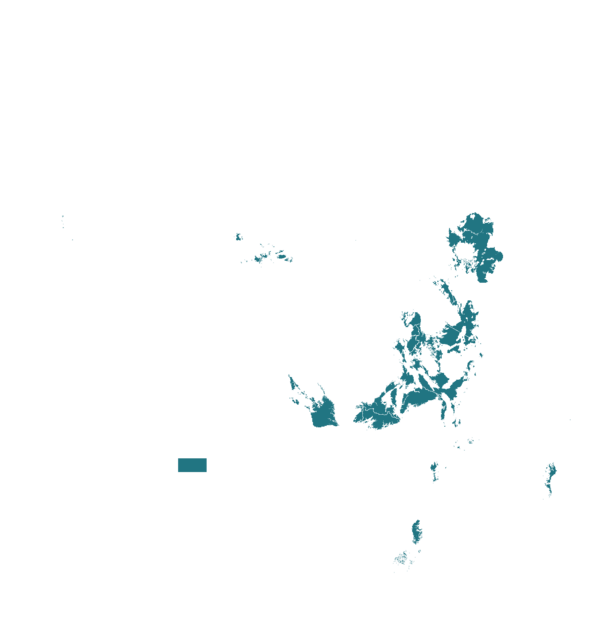
| AEZ | Subtropic - warm | Subtropic - cool | Tropic - warm | Tropic - cool |
|---|---|---|---|---|
| Arid | ||||
| Semiarid | ||||
| Subhumid | ||||
| Humid |
Source: HarvestChoice/IFPRI 2009
The United Nations Sustainable Development Goals that are applicable to this technology.
Improvement of fertility would cause yield increase, and therefore possibility to trade and improve rural economy.
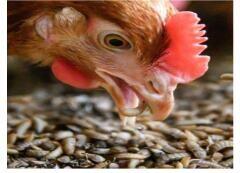
Finding the causes of yield gap (soil or leaf related) or can reduce food insecurity. Agrocares maximises food production by boosting fertilizer use efficiency (which is a known problem in Africa) and collecting big datasets of farmer information and productivity maps. Likewise testing animal feed increases the biomass conversion rate in animal products. Testing plant material can diagnose micronutrient deficiency, which is the cause of the "hidden hunger" in developing countries. Hidden hunger refers to micronutrient deficiencies (vitamins and minerals) despite adequate calorie intake.
Digital agriculture offers new opportunities of employment and market growth.
The Agrocares scanner can measure carbon stocks (Carbon Monitor Solution), which allows public or private stakeholders to account for carbon removal and evaluate if soil management practices are contributing to climate mitigation.
Improving fertilizer use efficiency would mean reducing wasted nutrient which do not end up in the plant biomass. This negative externalities are known to impact biodiversity.
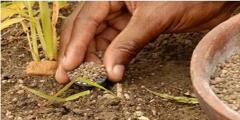
Scan
Collect a small sample of soil, leaf, or feed.
Hold down the scanner’s button and take 3 fast scans. The device uses near-infrared (NIR) light to capture the sample’s chemical fingerprint.
Upload
The scanner connects to your smartphone via Bluetooth and uses the official AgroCares Scanner app.
Scanned data is held offline and automatically uploads when internet access is restored.
Analyze
Uploaded data is sent to AgroCares’ global database, where it’s matched against thousands of samples.
Within about 10 minutes, the app returns nutrient values calculated by advanced algorithms.
Act
You receive a digital report in the app and on the web portal.
It displays nutrient levels and offers practical recommendations for fertilization, crop nutrition, or feed improvement.
Last updated on Feb 27, 2026
This technology can be used in the colored agro-ecological zones.


Agrocares Scanner: Soil, Feed and Leaves Nutrient Scanner
https://e-catalogs.taat-africa.org/gov/technologies/agrocares-scanner-soil-feed-and-leaves-nutrient-scanner
Last updated on 27 February 2026, printed on Jul 24, 2026
Enquiries e-catalogs@taat.africa