TAAT e-catalog
for
Development partners
https://e-catalogs.taat-africa.org/org/technologies/aquaculture-and-vegetables-integration-system-integrated-aquaculture-and-agriculture-systems
Aquaculture and Crops system for better yield
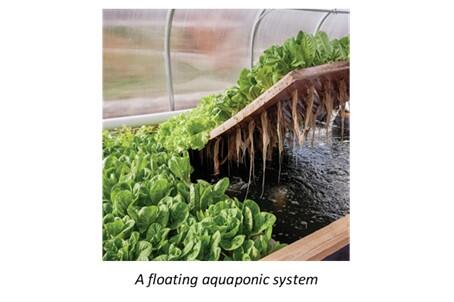
The "Integrated Aquaculture and Agriculture Systems" is like a teamwork between fish and plants. It puts fish tanks or ponds close to fields or greenhouses. This way, the water and nutrients from the fish can also be used to help the plants grow. The fish waste turns into food for the plants, and the plants help keep the water clean for the fish. It's like a natural cycle that saves money on food and helps both fish and crops grow better. It's a clever way to get more out of both fish farming and crop growing.
This technology is TAAT1 validated.
Adults 18 and over: Positive high
The poor: Positive high
Under 18: No impact
Women: Positive high
Climate adaptability: Highly adaptable
Biodiversity: Positive impact on biodiversity
Carbon footprint: Much less carbon released
Environmental health: Does not improve environmental health
Soil quality: Improves soil health and fertility
Water use: Much less water used
Low resource-use efficiency: Separate crop and aquaculture systems limit opportunities to recycle water and nutrients between production activities.
Land and water constraints: Limited productive land and competing water uses constrain sustainable expansion of food production.
Food and production constraints: Limited access to affordable protein and high fish-feed costs constrain food production and household food security.
Improved resource-use efficiency: Integration recycles water and nutrients between aquaculture and crop production, reducing waste and external input requirements.
Efficient use of land and water: Combining fish and vegetable production enables multiple food outputs from shared production resources.
Improved food production: Integrated production increases access to fish and vegetables while locally available feed resources can reduce dependence on costly commercial fish feed.
Integrated Aquaculture-Agriculture Systems (IAAS) establish a circular production model that recycles nutrient-rich fish water to irrigate and fertilize high-value vegetable crops. The technology addresses inefficient use of water and nutrients while improving farm productivity, profitability, food security, and resource-use efficiency. Suitable for urban and peri-urban agriculture, climate resilience, integrated farming systems, and agribusiness development programmes, it contributes to SDGs 2 (Zero Hunger), 3 (Good Health and Well-being), 8 (Decent Work and Economic Growth), 11 (Sustainable Cities and Communities), and 13 (Climate Action). The technology creates significant business opportunities for women and youth through fish production, vegetable cultivation, processing, marketing, and related service enterprises. To successfully integrate this technology, consider the following key actions :
one square metter of hydroponic plastic beds
average net income per acre
for 0.5 ha of fully equipped aquaponic system
Open source / open access
Scaling Readiness describes how complete a technology's development is and its ability to be scaled. It produces a score that measures a technology's readiness along two axes: the level of maturity of the idea itself, and the level to which the technology has been used so far.
Each axis goes from 0 to 9 where 9 is the “ready-to-scale” status. For each technology profile in the e-catalogs we have documented the scaling readiness status from evidence given by the technology providers. The e-catalogs only showcase technologies for which the scaling readiness score is at least 8 for maturity of the idea and 7 for the level of use.
The graph below represents visually the scaling readiness status for this technology, you can see the label of each level by hovering your mouse cursor on the number.
Read more about scaling readiness ›
Uncontrolled environment: validated
Common use by intended users, in the real world
| Maturity of the idea | Level of use | |||||||||
| 9 | ||||||||||
| 8 | ||||||||||
| 7 | ||||||||||
| 6 | ||||||||||
| 5 | ||||||||||
| 4 | ||||||||||
| 3 | ||||||||||
| 2 | ||||||||||
| 1 | ||||||||||
| 1 | 2 | 3 | 4 | 5 | 6 | 7 | 8 | 9 | ||
| Country | Testing ongoing | Tested | Adopted |
|---|---|---|---|
| Benin | –No ongoing testing | –Not tested | Adopted |
| Botswana | –No ongoing testing | –Not tested | Adopted |
| Burkina Faso | –No ongoing testing | –Not tested | Adopted |
| Burundi | –No ongoing testing | –Not tested | Adopted |
| Cameroon | –No ongoing testing | –Not tested | Adopted |
| Central African Republic | –No ongoing testing | –Not tested | Adopted |
| Côte d'Ivoire | –No ongoing testing | –Not tested | Adopted |
| Equatorial Guinea | –No ongoing testing | –Not tested | Adopted |
| Ethiopia | –No ongoing testing | –Not tested | Adopted |
| Ghana | –No ongoing testing | –Not tested | Adopted |
| Kenya | –No ongoing testing | –Not tested | Adopted |
| Liberia | –No ongoing testing | –Not tested | Adopted |
| Madagascar | –No ongoing testing | –Not tested | Adopted |
| Niger | –No ongoing testing | –Not tested | Adopted |
| Nigeria | –No ongoing testing | –Not tested | Adopted |
| Rwanda | –No ongoing testing | –Not tested | Adopted |
| Senegal | –No ongoing testing | –Not tested | Adopted |
| Sierra Leone | –No ongoing testing | –Not tested | Adopted |
| South Sudan | –No ongoing testing | –Not tested | Adopted |
| Tanzania, United Republic | –No ongoing testing | –Not tested | Adopted |
| The Democratic Republic of the Congo | –No ongoing testing | –Not tested | Adopted |
| The Republic of the Sudan | –No ongoing testing | –Not tested | Adopted |
| Togo | –No ongoing testing | –Not tested | Adopted |
| Uganda | –No ongoing testing | –Not tested | Adopted |
| Zambia | –No ongoing testing | –Not tested | Adopted |
| Zimbabwe | –No ongoing testing | –Not tested | Adopted |
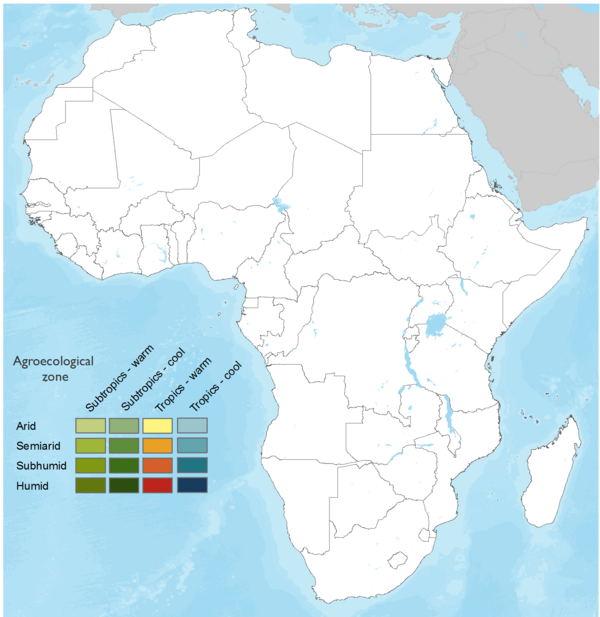
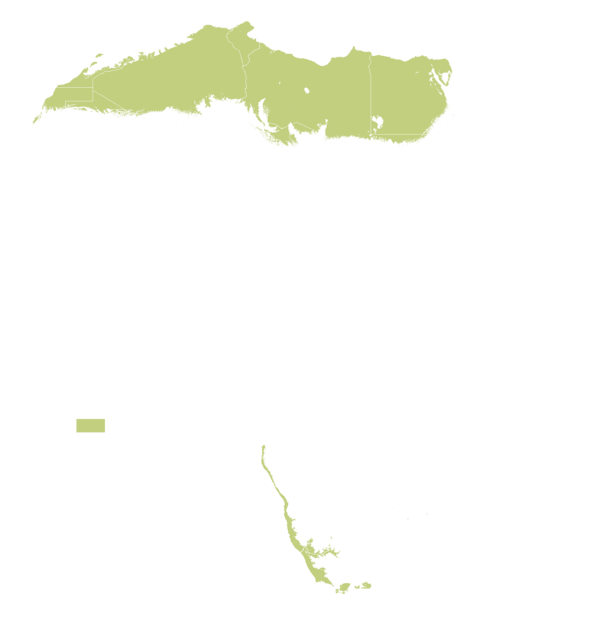
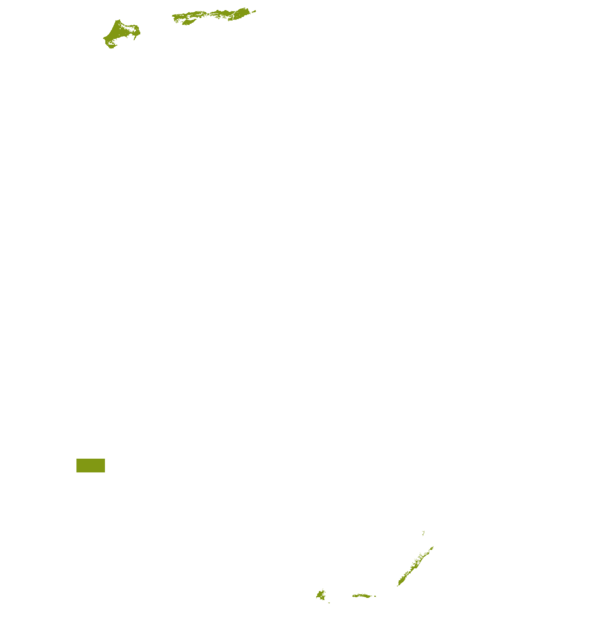
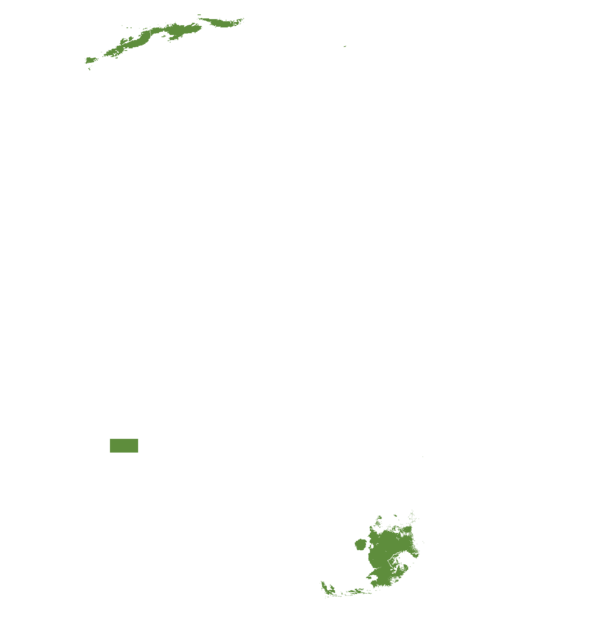
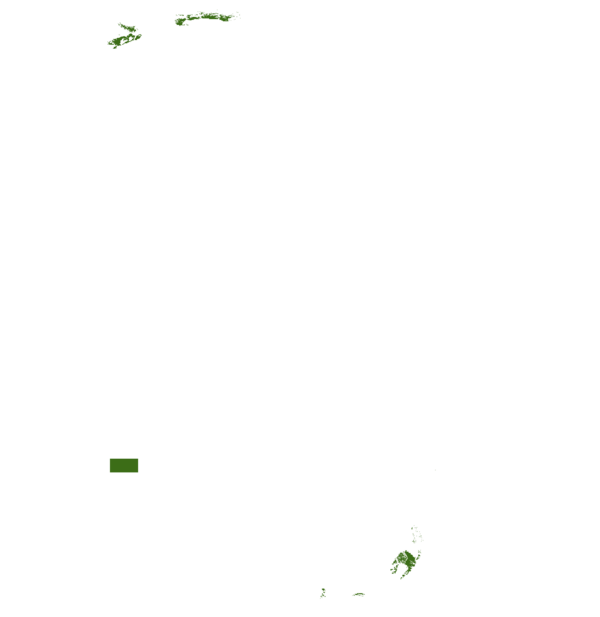
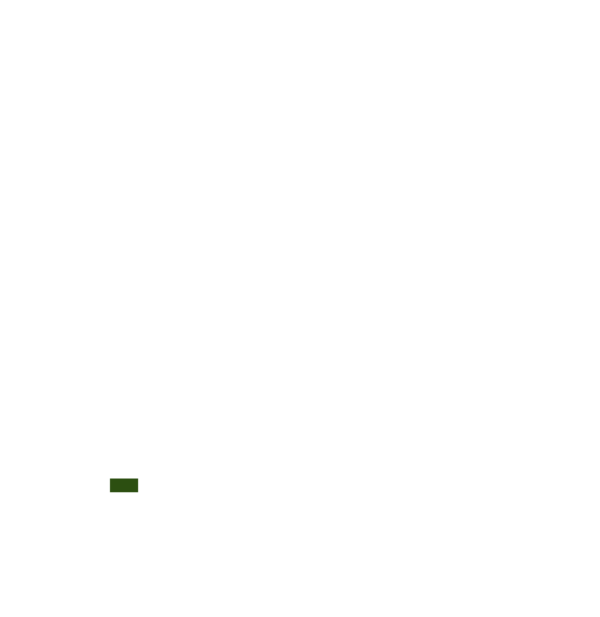
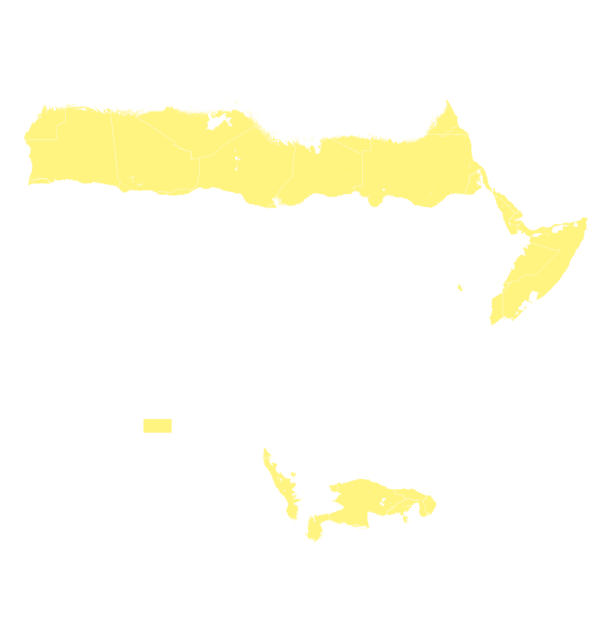
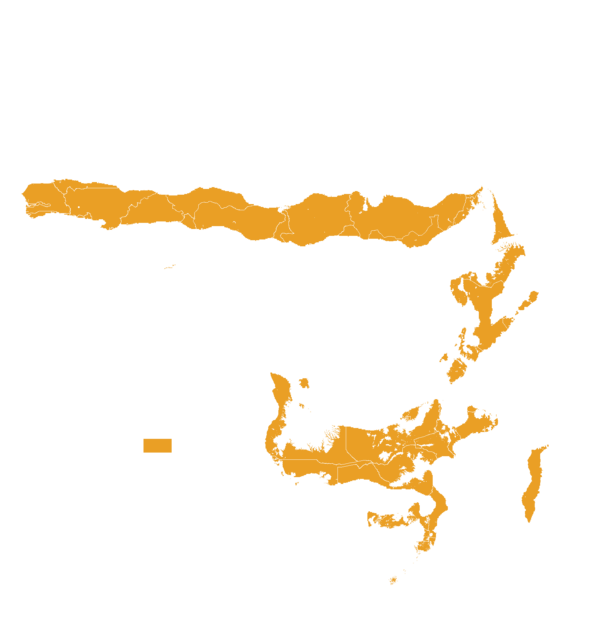
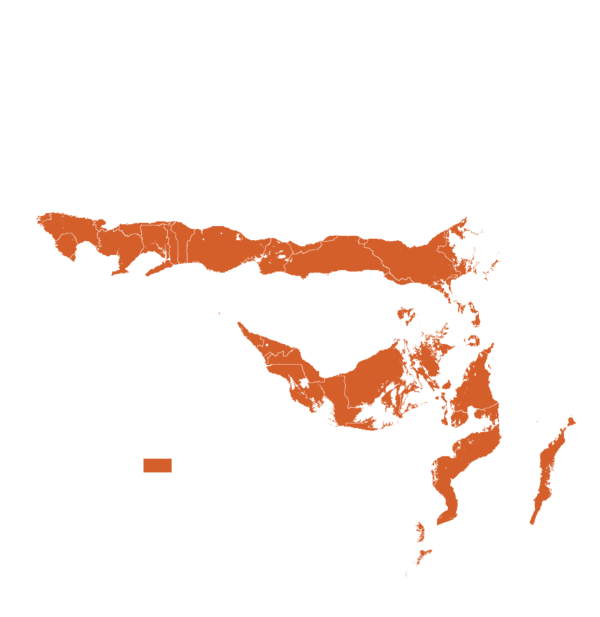
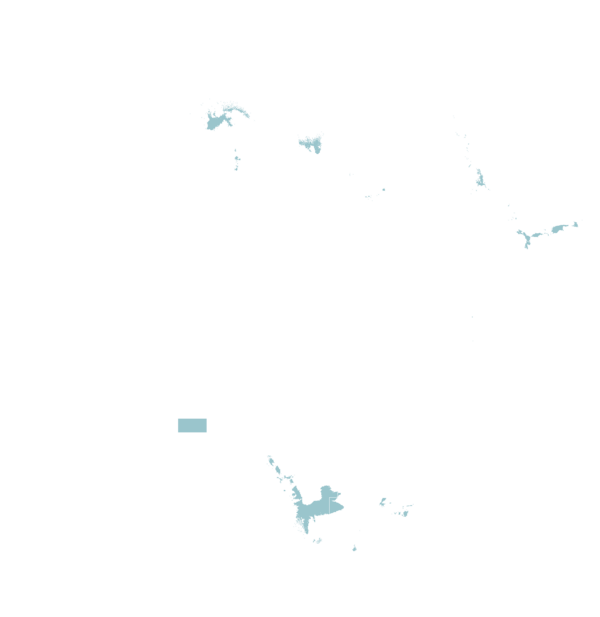
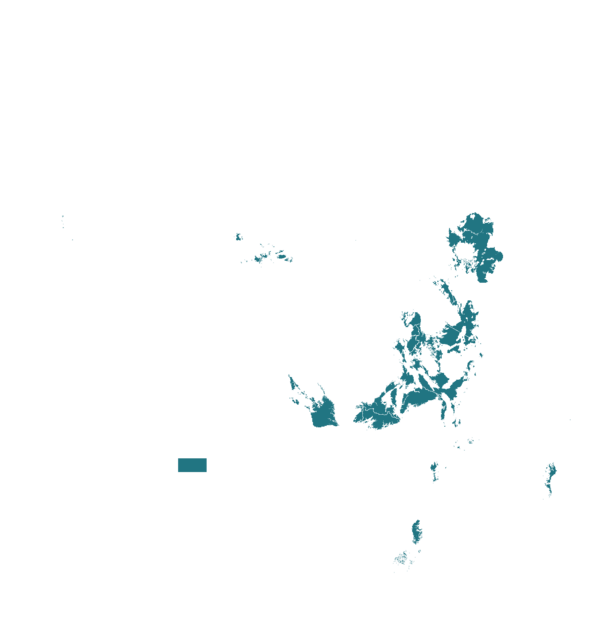
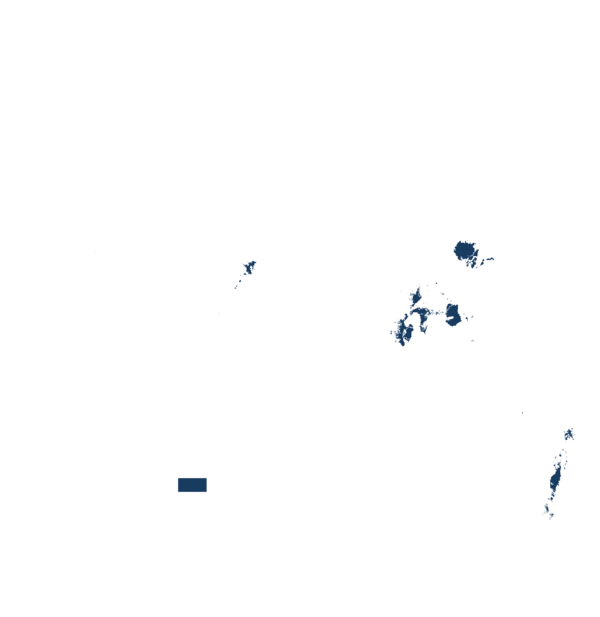
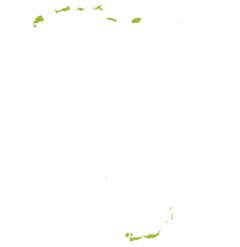
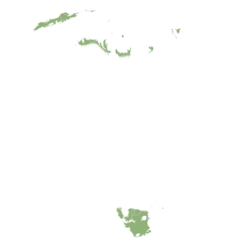
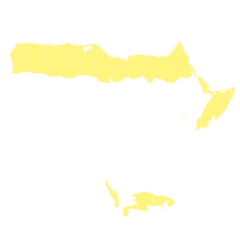
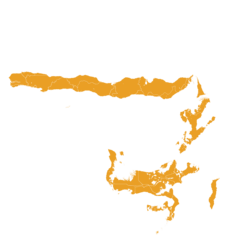
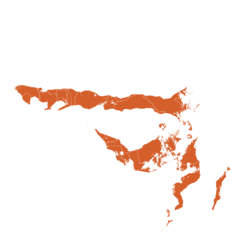
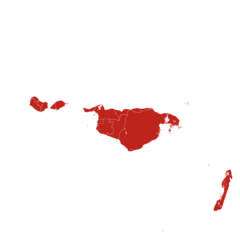
This technology can be used in the colored agro-ecological zones. Any zones shown in white are not suitable for this technology.




| AEZ | Subtropic - warm | Subtropic - cool | Tropic - warm | Tropic - cool |
|---|---|---|---|---|
| Arid | ||||
| Semiarid | ||||
| Subhumid | ||||
| Humid |
Source: HarvestChoice/IFPRI 2009
The United Nations Sustainable Development Goals that are applicable to this technology.
Last updated on Sep 22, 2026
This technology can be used in the colored agro-ecological zones.







Aquaculture and vegetables Integration System: Integrated Aquaculture and Agriculture Systems
https://e-catalogs.taat-africa.org/org/technologies/aquaculture-and-vegetables-integration-system-integrated-aquaculture-and-agriculture-systems
Last updated on 22 September 2026, printed on Oct 22, 2026
Enquiries e-catalogs@taat.africa