
TAAT e-catalog
for
private sector
https://e-catalogs.taat-africa.org/com/technologies/ricemore-digital-rice-activity-monitoring-and-reporting-system
A digital solution for monitoring and reporting rice activities
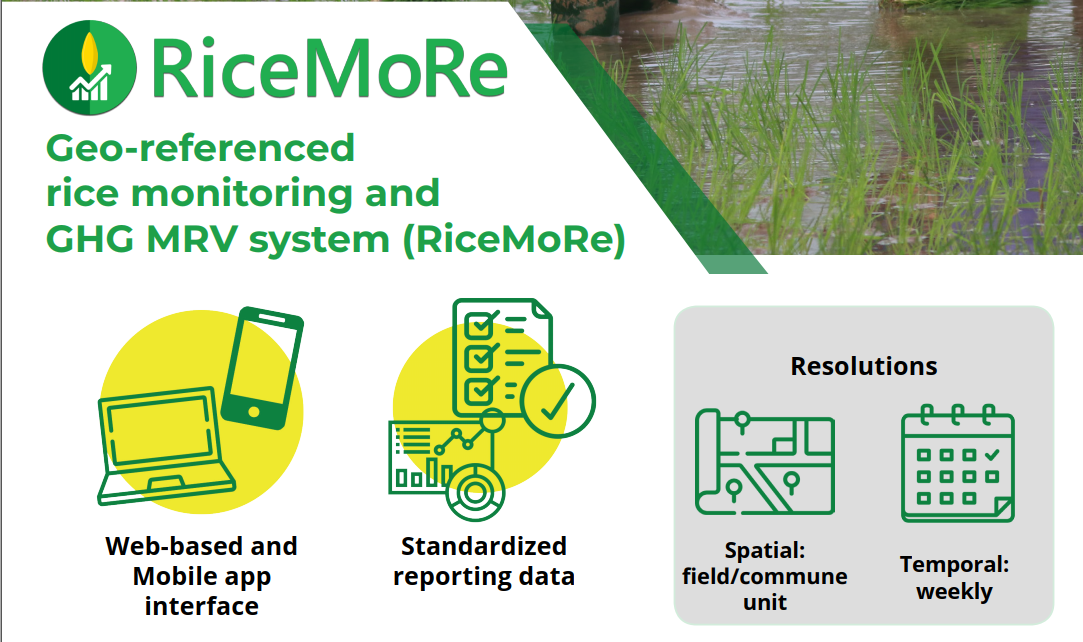
RiceMoRe is a web- and mobile-based digital system for managing and monitoring rice production data across farmers, cooperatives, and production units. It uses standardized digital forms to record production progress, farming practices, varieties, yields, and other field-level information, with georeferenced records consolidated across production networks. The system enables users to track and compare farming practices and production performance, visualize data through maps, charts, and tables, and generate structured reports. For private-sector actors working with rice producers or production networks, these capabilities can provide structured, location-specific visibility into production activities and performance, supporting operational monitoring and decision-making. Farm-level activity data can also be connected through an API to the SECTOR GHG Calculator to support GHG emission estimation.
This technology is pre-validated.
Co-created, tested, and implemented in Vietnam
Initial piloting in Can Tho province
Open source / open access
RiceMoRe can be used by different actors involved in rice production and value chains, from individual farmers and cooperatives to companies managing larger production networks. The way the system is used and configured will depend on the scale of operations, number of users, type of production data to be collected, reporting requirements, and level of data management needed.
For organizations considering RiceMoRe, it is therefore important to first identify the main users and their specific monitoring needs, and then define the appropriate data collection, reporting, and management arrangements. The following points highlight the main considerations for different types of private-sector users and can help organizations assess how RiceMoRe could fit into their existing operations.
RiceMoRe is relevant for rice farmers who need to record and track their farming activities, particularly farmers working with companies, cooperatives, or sustainable production projects.
RiceMoRe is relevant for rice cooperatives that need to manage and monitor production activities across their members and consolidate farm-level information at cooperative level.
RiceMoRe is relevant for companies producing rice or working with contracted farmers and cooperatives that need to monitor production activities across multiple farms and production areas.
| Target Group | Positive Impacts |
|---|---|
| Women smallholder farmers with low digital literacy |
|
| Smallholder farmers with low digital literacy in areas with limited internet connectivity |
|
| Smallholder farmers with low digital literacy and weak access to collective support structures |
|
| Smallholder farmers with limited internet connectivity and weak access to collective support structures |
|
Climate adaptability: Highly adaptable
The system is online and flexible, so it can be used in any climate setting
Farmer climate change readiness: Significant improvement
Informs government, extension agencies, cooperatives to provide suitable climate advisories to farmers.
Biodiversity: No impact on biodiversity
Carbon footprint: Much less carbon released
Supports MRV for emission reduction.
Environmental health: Moderately improves environmental health
Supports extension to provide advisory related to environment and projects/enterprises to monitor farming practices that have environmental impacts such as pesticide or fertilizer management.
Soil quality: Not yet estimated
Scaling Readiness describes how complete a technology's development is and its ability to be scaled. It produces a score that measures a technology's readiness along two axes: the level of maturity of the idea itself, and the level to which the technology has been used so far.
Each axis goes from 0 to 9 where 9 is the “ready-to-scale” status. For each technology profile in the e-catalogs we have documented the scaling readiness status from evidence given by the technology providers. The e-catalogs only showcase technologies for which the scaling readiness score is at least 8 for maturity of the idea and 7 for the level of use.
The graph below represents visually the scaling readiness status for this technology, you can see the label of each level by hovering your mouse cursor on the number.
Read more about scaling readiness ›
Uncontrolled environment: tested
Common use by intended users, in the real world
| Maturity of the idea | Level of use | |||||||||
| 9 | ||||||||||
| 8 | ||||||||||
| 7 | ||||||||||
| 6 | ||||||||||
| 5 | ||||||||||
| 4 | ||||||||||
| 3 | ||||||||||
| 2 | ||||||||||
| 1 | ||||||||||
| 1 | 2 | 3 | 4 | 5 | 6 | 7 | 8 | 9 | ||
| Target Group | Positive Impacts |
|---|---|
| Women smallholder farmers with low digital literacy |
|
| Smallholder farmers with low digital literacy in areas with limited internet connectivity |
|
| Smallholder farmers with low digital literacy and weak access to collective support structures |
|
| Smallholder farmers with limited internet connectivity and weak access to collective support structures |
|
| Target group | Potential unintended impacts | Mitigation measures |
|---|---|---|
| Women smallholder farmers with low digital literacy |
|
|
| Smallholder farmers with low digital literacy and limited internet connectivity |
|
|
| Smallholder farmers with low digital literacy and weak access to collective support structures |
|
|
| Smallholder farmers with limited internet connectivity and weak access to collective support structures |
|
|
| Target group | Adoption barriers | Mitigation measures |
|---|---|---|
| Women smallholder farmers with low digital literacy |
|
|
| Smallholder farmers with low digital literacy and limited internet connectivity |
|
|
| Smallholder farmers with low digital literacy and weak access to collective support structures |
|
|
| Smallholder farmers with limited internet connectivity and weak access to collective support structures |
|
|
| Country | Testing ongoing | Tested | Adopted | |
|---|---|---|---|---|
| This technology has not been tested or adopted in any country. | ||||
This technology can be used in the colored agro-ecological zones. Any zones shown in white are not suitable for this technology.
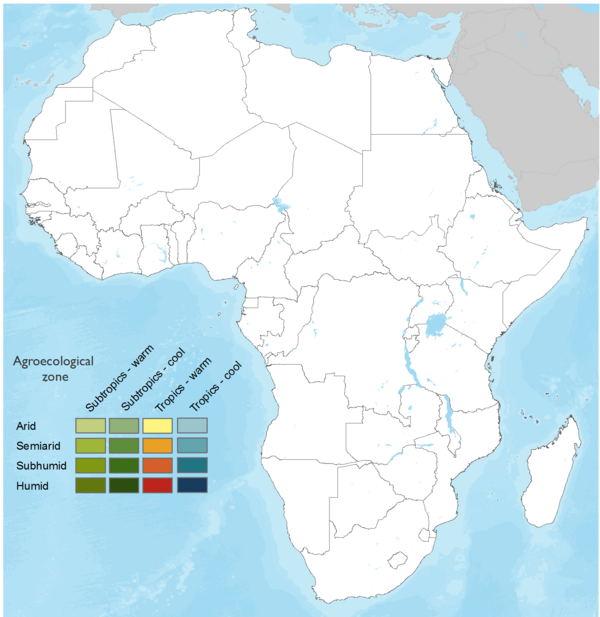
| AEZ | Subtropic - warm | Subtropic - cool | Tropic - warm | Tropic - cool |
|---|---|---|---|---|
| Arid | – | – | – | – |
| Semiarid | – | – | – | – |
| Subhumid | – | – | – | – |
| Humid | – | – | – | – |
Source: HarvestChoice/IFPRI 2009
The United Nations Sustainable Development Goals that are applicable to this technology.
Supports effective agricultural planning and monitoring through timely, standardized rice production data.

Provides digital infrastructure for agricultural data collection, management, GIS-based monitoring, and reporting.
Supports monitoring and benchmarking of sustainable, low-emission, and agroecological farming practices.

Supports GHG emissions estimation and MRV for low-emission rice production.

Supports data sharing and collaboration among government, research, development, farmer, and private-sector actors.
RiceMoRe is used to collect and manage rice production information throughout the cropping season, with data collected weekly, every two weeks, or at other intervals depending on monitoring needs.
Last updated on Sep 24, 2026

RiceMoRe: Digital rice activity monitoring and reporting system
https://e-catalogs.taat-africa.org/com/technologies/ricemore-digital-rice-activity-monitoring-and-reporting-system
Last updated on 24 September 2026, printed on Oct 22, 2026
Enquiries e-catalogs@taat.africa