
Logo
TAAT e-catalog for government
https://e-catalogs.taat-africa.org/gov/technologies/ricemore-digital-rice-activity-monitoring-and-reporting-system
Request information View pitch brochure

RiceMoRe: Digital rice activity monitoring and reporting system

A digital solution for monitoring and reporting rice activities

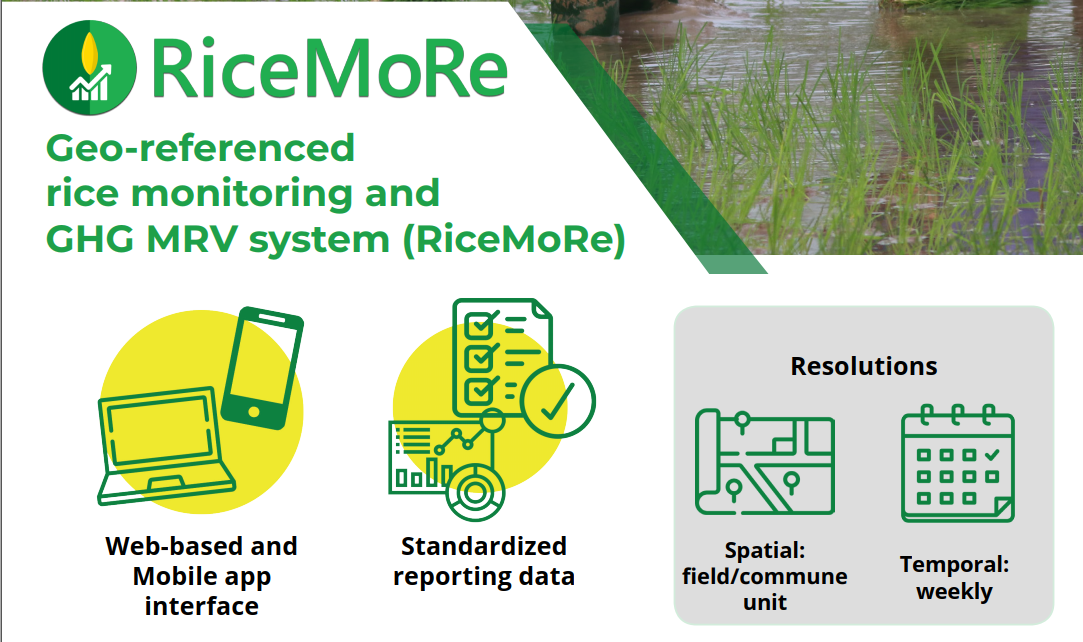
RiceMoRe is a web- and mobile-based digital system for recording, managing, and monitoring rice production data across farmers, cooperatives, and production units. It uses standardized digital forms to capture production progress, farming practices, varieties, yields, and other field-level information, while georeferenced records provide a consolidated view of production networks. The system allows users to track and compare farming practices and production performance and visualize information through maps, charts, and tables. It can also generate structured reports, providing government institutions with organized, location-specific evidence to support the monitoring of rice production, planning, and decision-making. Farm-level activity data can additionally be connected through an API to the SECTOR GHG Calculator to support GHG emission estimation.
This technology is pre-validated.

8•9

Scaling readiness: idea maturity 8/9; level of use 9/9

Positive impacts: 8

Target  Group Positive Impacts
Women smallholder farmers with low digital literacy
  • Greater visibility of farming activities: Standardized records can make women farmers’ production activities and practices more visible within farm, cooperative, project, or institutional monitoring systems.
  • Accessible participation in data collection: User-friendly predefined forms can facilitate participation in farm-data reporting without requiring advanced digital skills.
Smallholder farmers with low digital literacy in areas with limited internet connectivity
  • More structured participation in reporting: Standardized, user-friendly forms simplify the recording of farm-level information such as cultivated area, varieties, production progress, practices, and yields.
  • Inclusion in wider production monitoring: Farm-level records can be aggregated through existing reporting structures, allowing participating smallholders to be represented in broader production monitoring.
Smallholder farmers with low digital literacy and weak access to collective support structures
  • Structured farm records: Standardized forms provide a simpler and consistent way to record production activities and practices, including water, fertilizer, and straw management.
  • Access to selected public functions: Some RiceMoRe functions, including GHG emission estimation, can be accessed by public users without requiring an account.
Smallholder farmers with limited internet connectivity and weak access to collective support structures
  • Spatial visibility of production areas: Georeferenced records allow participating farms and production areas to be represented in spatial agricultural monitoring.
  • Integration into wider monitoring: Farm-level production and practice data can be consolidated across geographic or administrative levels, increasing the representation of participating production areas in broader monitoring systems.


More...

Climate adaptability: Highly adaptable

The system is online and flexible, so it can be used in any climate setting

Farmer climate change readiness: Significant improvement

Informs government, extension agencies, cooperatives to provide suitable climate advisories to farmers.

Biodiversity: No impact on biodiversity

Carbon footprint: Much less carbon released

Supports MRV for emission reduction.

Environmental health: Moderately improves environmental health

Supports extension to provide advisory related to environment and projects/enterprises to monitor farming practices that have environmental impacts such as pesticide or fertilizer management.

Soil quality: Not yet estimated

Problem

  • Non-standardized data collection: Inconsistent data collection and reporting across programs and administrative levels, increasing the risk of inefficiencies and data inaccuracies.
  • Time-consuming data consolidation: Manual compilation and consolidation of production data can delay access to information needed for agricultural monitoring, planning, and decision-making.
  • Poor data synchronization and traceability: Limited integration and traceability of production data can constrain information sharing and the development of effective MRV systems.
  • Limited geographic visibility: Lack of georeferenced production data makes it difficult to locate and monitor production areas, identify geographic patterns, and visualize production hotspots.
  • Limited GHG quantification: Difficulty estimating GHG emissions and emission reductions at field or project level can constrain the assessment of climate mitigation outcomes and MRV.

Solution

  • Standardized data management: A standardized digital system and reporting format enables structured data collection, review, and validation across different administrative levels.
  • Automated data aggregation: Production data collected at field or local level can be automatically consolidated across administrative levels, reducing manual compilation and facilitating access to aggregated information for agricultural monitoring and planning.
  • Synchronized and traceable data: Digitally recorded and synchronized production data facilitates data integration across institutions and supports the development of more effective monitoring, reporting, and verification (MRV) systems.
  • Georeferenced production monitoring: Georeferenced data and map-based visualization enable officials to locate and monitor production areas, identify geographic patterns and production hotspots, and support evidence-based decision-making.
  • GHG emissions estimation: Farm-level activity data can be connected through an API to the SECTOR GHG Calculator, supporting the estimation of GHG emissions and emission reductions at field or project level and contributing to climate-related MRV.

Key points to design your project

RiceMoRe provides a standardized digital system for collecting, managing, monitoring, and reporting rice production data from the local to national level. By combining standardized reporting with georeferenced data and map-based visualization, it gives government institutions a clearer view of where rice is being produced, how production is progressing, and where specific areas may require attention. The system can also support national monitoring, reporting, and verification (MRV) by linking farm-level production activity data with GHG emissions information. To successfully integrate RiceMoRe into government systems:

  • Integrate RiceMoRe into existing reporting structures: Build on established government reporting processes and institutional responsibilities, linking data flows from commune and district levels through provincial, regional, and national levels rather than creating a parallel system.
  • Agree on what data should be collected and reported: Government institutions should jointly define the key data fields, indicators, reporting frequency, validation procedures, and responsibilities at each level to ensure consistent data collection and reporting.
  • Train users at all relevant levels: Provide practical training and ongoing technical support on data collection, review and validation, reporting, map-based visualization, and the use of aggregated information for monitoring and planning.
  • Establish clear data quality and traceability procedures: Define how data will be checked, validated, corrected, and synchronized at each reporting level while maintaining a link between aggregated information and its original records.
  • Keep geographic information up to date: Regularly maintain administrative boundaries, production locations, and other geographic information so that production data can be accurately mapped and used to identify areas requiring monitoring or intervention.
  • Connect RiceMoRe with existing government information systems: Where relevant, enable data exchange with Ministry systems and other agricultural databases to reduce duplicate reporting, improve interoperability, and make better use of existing data.
  • Assign clear responsibility for long-term management: Establish institutional ownership for system administration, data management, maintenance, user support, and future updates, with sufficient flexibility to adapt the system as government monitoring needs evolve.
  • Monitor adoption and data quality: Track indicators such as the number of reporting units using RiceMoRe, data completeness and timeliness, validation and traceability, use of mapping functions, and the extent to which RiceMoRe data inform agricultural planning, GHG MRV, and policy decisions.

2018–2024 Timeline

Co-created, tested, and implemented in Vietnam

2020–2021 Timeline

Initial piloting in Can Tho province

IP

Open source / open access

Technical Characteristics of RiceMoRe

1. System Architecture & Platform
  • Open-Source Infrastructure: Built on open-source web and mobile technologies, incurring zero software licensing fees and offering a low-cost, highly replicable system.
  • Multi-Platform Access: Features both a web-based management portal and mobile applications for Android and iOS devices.
  • Flexible Database & System Integration: Allows data storage in local, cloud, or custom organizational databases. It incorporates APIs to connect farm-level activity data with independent greenhouse gas (GHG) calculation engines and enables data exchange with existing Ministry systems.
2. Spatial & Temporal Resolution
  • Spatial Granularity: Operates at the field and commune unit level, utilizing georeferenced administrative boundary maps (compatible with GIS tools such as QGIS for polygon management).
  • Temporal Frequency: Supports weekly, bi-weekly, seasonal, and annual data collection, monitoring, and reporting schedules.
3. Hierarchical Data Flow & Approval Workflows
  • 5-Tier Administrative Hierarchy: Links workflows structured directly across Commune, District, Province, Region/Zone, and National levels.
  • Automated Data Aggregation: Automatically consolidates records from commune level up to district, province, region, and national scales, eliminating manual compilation while preserving traceability back to original commune entries.
  • Multi-Stage Validation Protocol: Implements status-tracked review and approval workflows (e.g., Draft, Submitted, Approved, or Rejected) where upper-level officials validate entries before they are committed to the national database.
4. Core Data Modules & Functional Indicators
  • 7 Standardized Reporting Modules: Features structured modules for Production Planning, Planting Progress, Growth Stages, Harvesting Progress, Technical Practice Application (e.g., seed rates, fertilizer reduction, water-saving techniques), Mechanization, and Yield Loss/Damage (from natural disasters or pests).
  • Customizable Forms: Supports customizable survey forms, indicators, and criteria tailored to contracted farming, company standards, or specific project targets.
5. GIS Mapping & Visual Analytics
  • 3 Base Map Options: Integrates Google Terrain, Google Satellite, and Bing Maps.
  • 6 Thematic Production Layers: Generates spatial maps for planting progress, growth stages, harvesting progress, technical application, mechanization, and damage/yield loss tracking.
  • Interactive Spatial Tools: Provides administrative area filters, seasonal query tools, map legends, and interactive map navigation (zooming and panning).
6. Automated GHG MRV Engine
  • Activity-Based Emission Calculation: Translates field management data (such as fertilizer application, straw management, and water regimes) into automated GHG emission estimates to support national Measurement, Reporting, and Verification (MRV).
  • Public Accessibility: Features an open-access GHG calculation tool accessible to public users and farmers without requiring a user login.
7. User Management & Security
  • Role-Based Access Control (RBAC): Manages permissions based on administrative levels or organizational units.
  • Granular Action Permissions: Controls specific functional rights for viewing, adding, editing, deleting, and importing/exporting Excel data.
  • Audit Logging & Security: Tracks login history and user operations in real-time, supported by phone/email account management and OTP password recovery.

Scaling Readiness describes how complete a technology's development is and its ability to be scaled. It produces a score that measures a technology's readiness along two axes: the level of maturity of the idea itself, and the level to which the technology has been used so far.

Each axis goes from 0 to 9 where 9 is the “ready-to-scale” status. For each technology profile in the e-catalogs we have documented the scaling readiness status from evidence given by the technology providers. The e-catalogs only showcase technologies for which the scaling readiness score is at least 8 for maturity of the idea and 7 for the level of use.

The graph below represents visually the scaling readiness status for this technology, you can see the label of each level by hovering your mouse cursor on the number.

Read more about scaling readiness ›

Scaling readiness score of this technology

Maturity of the idea 8 out of 9

Uncontrolled environment: tested

Level of use 9 out of 9

Common use by intended users, in the real world

Maturity of the idea Level of use
9
8
7
6
5
4
3
2
1
1 2 3 4 5 6 7 8 9

Positive impact 8

Target  Group Positive Impacts
Women smallholder farmers with low digital literacy
  • Greater visibility of farming activities: Standardized records can make women farmers’ production activities and practices more visible within farm, cooperative, project, or institutional monitoring systems.
  • Accessible participation in data collection: User-friendly predefined forms can facilitate participation in farm-data reporting without requiring advanced digital skills.
Smallholder farmers with low digital literacy in areas with limited internet connectivity
  • More structured participation in reporting: Standardized, user-friendly forms simplify the recording of farm-level information such as cultivated area, varieties, production progress, practices, and yields.
  • Inclusion in wider production monitoring: Farm-level records can be aggregated through existing reporting structures, allowing participating smallholders to be represented in broader production monitoring.
Smallholder farmers with low digital literacy and weak access to collective support structures
  • Structured farm records: Standardized forms provide a simpler and consistent way to record production activities and practices, including water, fertilizer, and straw management.
  • Access to selected public functions: Some RiceMoRe functions, including GHG emission estimation, can be accessed by public users without requiring an account.
Smallholder farmers with limited internet connectivity and weak access to collective support structures
  • Spatial visibility of production areas: Georeferenced records allow participating farms and production areas to be represented in spatial agricultural monitoring.
  • Integration into wider monitoring: Farm-level production and practice data can be consolidated across geographic or administrative levels, increasing the representation of participating production areas in broader monitoring systems.


Unintended impact 8

Target group Potential unintended impacts Mitigation measures
Women smallholder farmers with low digital literacy
  • Reduced participation in data management: If data entry is handled mainly by more digitally skilled household members or field actors, women may have less direct involvement in recording and reviewing their farming activities.
  • Underrepresentation in monitoring: Lower participation in digital reporting could result in women's activities being less completely represented in aggregated data.
  • Ensure direct participation: Include women directly in training, data entry, review, and validation activities.
  • Monitor representation: Check participation and completeness of records by gender and address identified gaps.
Smallholder farmers with low digital literacy and limited internet connectivity
  • Incomplete or delayed records: Difficulties entering or transmitting digital data may result in incomplete or delayed production records.
  • Underrepresentation in monitoring: Farmers unable to report as regularly as better-connected users may become less visible in aggregated and spatial monitoring.
  • Use existing reporting lines: Where direct farmer reporting is difficult, use established local reporting structures to support data collection, review, and transmission.
  • Monitor reporting coverage: Identify persistent gaps in reporting and provide targeted support to poorly represented users or areas.
Smallholder farmers with low digital literacy and weak access to collective support structures
  • Dependence on intermediaries: Farmers requiring assistance may become dependent on other actors to enter or manage their production information.
  • Unequal data visibility: Farmers receiving less organizational or technical support may generate less complete records than farmers integrated into stronger reporting networks.
  • Maintain farmer involvement: Use assisted data entry where necessary while allowing farmers to participate in and review the information recorded about their farms.
  • Extend participatory implementation: During deployment, involve farmers outside strong collective structures in adapting reporting arrangements and identifying support needs.
Smallholder farmers with limited internet connectivity and weak access to collective support structures
  • Geographic data gaps: Less regular reporting from poorly connected and weakly supported production areas may create gaps in georeferenced datasets.
  • Bias in data-based decisions: Persistent geographic gaps could cause monitoring and planning to reflect better-represented production areas more strongly.
  • Address coverage gaps: Use existing local reporting structures or other appropriate collection arrangements to improve data coverage in poorly connected areas.
  • Check representativeness: Assess geographic coverage and data completeness before using aggregated information for planning and targeting.

Barriers 11

Target group Adoption barriers Mitigation measures
Women smallholder farmers with low digital literacy
  • Limited digital skills: Limited familiarity with web/mobile tools may constrain independent use despite RiceMoRe's user-friendly design.
  • Unequal access to devices or training: Limited access to digital equipment or technical training may reduce direct participation.
  • Provide targeted practical training: Complement RiceMoRe's simplified interface with hands-on onboarding and continued support adapted to users' skills.
  • Ensure inclusive access: Include women directly in training and deployment and provide shared or institution-supported equipment where needed.
Smallholder farmers with low digital literacy and limited internet connectivity
  • Limited digital skills: Even with standardized and user-friendly forms, some users may still require assistance with digital data entry.
  • Limited connectivity: Weak or unstable internet can constrain regular transmission of production data.
  • Limited access to digital equipment: Some smallholders may not have regular access to suitable smartphones or computers.
  • Provide practical user support: Use hands-on onboarding and assistance while taking advantage of RiceMoRe's predefined and customizable forms.
  • Use existing reporting structures: Where direct transmission is difficult, organize data collection and transmission through established local reporting lines.
  • Facilitate equipment access: Provide shared or institution-supported devices where individual access is limited.
Smallholder farmers with low digital literacy and weak access to collective support structures
  • Limited digital skills: Farmers may still require assistance to use the system despite its simplified data-entry design.
  • Limited access to technical support: Farmers weakly connected to cooperatives, extension services, or institutional networks may have less access to onboarding and troubleshooting.
  • Limited reach of organized deployment: Farmers outside established reporting networks may be harder to include when RiceMoRe is deployed through institutional structures.
  • Provide adapted training: Use RiceMoRe's flexible forms together with practical onboarding appropriate to users' digital skills.
  • Extend support beyond organized groups: Make extension or other field-level technical support accessible to farmers outside cooperative networks.
  • Use participatory deployment: Identify and involve weakly connected farmers when adapting RiceMoRe to a new implementation context.
Smallholder farmers with limited internet connectivity and weak access to collective support structures
  • Limited connectivity: Poor network coverage can constrain regular transmission and use of web/mobile functions.
  • Limited access to support: Weak links to cooperatives or institutional structures may reduce access to assistance when technical or reporting problems occur.
  • Implementation costs: RiceMoRe has no software licensing fees, but access to equipment, connectivity, training, hosting, and technical support may still require resources.
  • Adapt reporting arrangements: Use existing reporting lines or other locally appropriate arrangements where direct digital transmission is unreliable.
  • Establish accessible support: Ensure technical assistance reaches users outside strong cooperative or institutional networks.
  • Budget beyond licensing: Plan resources for equipment, connectivity, training, hosting, and technical support despite the absence of software licensing fees.

Countries with a green colour
Tested & adopted
Countries with a bright green colour
Adopted
Countries with a yellow colour
Tested
Countries with a blue colour
Testing ongoing
Egypt Equatorial Guinea Ethiopia Algeria Angola Benin Botswana Burundi Burkina Faso Democratic Republic of the Congo Djibouti Côte d’Ivoire Eritrea Gabon Gambia Ghana Guinea Guinea-Bissau Cameroon Kenya Libya Liberia Madagascar Mali Malawi Morocco Mauritania Mozambique Namibia Niger Nigeria Republic of the Congo Rwanda Zambia Senegal Sierra Leone Zimbabwe Somalia South Sudan Sudan South Africa Eswatini Tanzania Togo Tunisia Chad Uganda Western Sahara Central African Republic Lesotho
Countries where the technology is being tested or has been tested and adopted
Country Testing ongoing Tested Adopted
This technology has not been tested or adopted in any country.

This technology can be used in the colored agro-ecological zones. Any zones shown in white are not suitable for this technology.
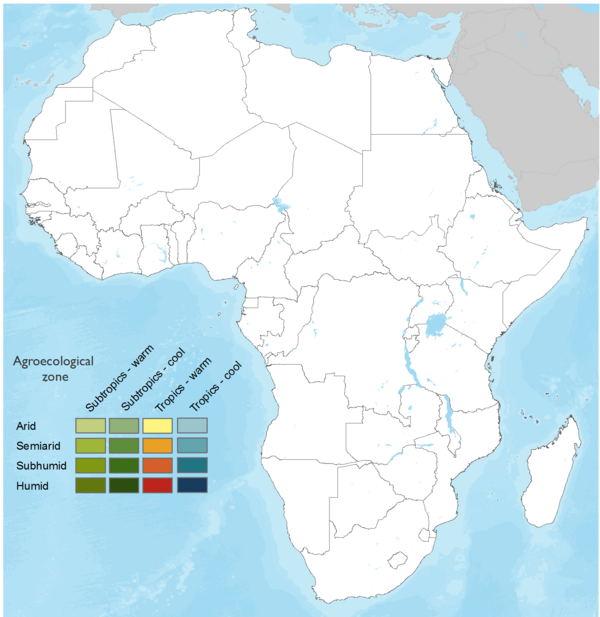
Agro-ecological zones where this technology can be used
AEZ Subtropic - warm Subtropic - cool Tropic - warm Tropic - cool
Arid
Semiarid
Subhumid
Humid

Source: HarvestChoice/IFPRI 2009

The United Nations Sustainable Development Goals that are applicable to this technology.
Sustainable Development Goal 2: zero hunger
Goal 2: zero hunger

Supports effective agricultural planning and monitoring through timely, standardized rice production data.

Sustainable Development Goal 9: industry, innovation and infrastructure
Goal 9: industry, innovation and infrastructure

Provides digital infrastructure for agricultural data collection, management, GIS-based monitoring, and reporting.
Sustainable Development Goal 12: responsible production and consumption
Goal 12: responsible production and consumption

Supports monitoring and benchmarking of sustainable, low-emission, and agroecological farming practices.

Sustainable Development Goal 13: climate action
Goal 13: climate action

Supports GHG emissions estimation and MRV for low-emission rice production.

Sustainable Development Goal 17: partnerships for the goals
Goal 17: partnerships for the goals

Supports data sharing and collaboration among government, research, development, farmer, and private-sector actors.

RiceMoRe is used to collect and manage rice production information throughout the cropping season, with data collected weekly, every two weeks, or at other intervals depending on monitoring needs.

  1. Set up: Define what information needs to be collected, when it should be collected, and how it will be reported.
  2. Collect data: Collect production information directly from the field, farms, cooperatives, projects, or other production units using digital forms.
  3. Store and manage: Store and manage the collected information securely in a centralized system, either on the organization’s own infrastructure or in a trusted cloud environment.
  4. Consolidate and analyze: Automatically bring data together across farms, locations, reporting periods, and administrative levels to identify production trends and performance.
  5. Visualize: View and explore the information through maps, charts, and tables, making it easier to understand where activities are taking place and how production is performing.
  6. Report and act: Export data and generate reports that provide evidence for planning, monitoring, decision-making, and follow-up actions.

Last updated on Sep 11, 2026